Introduction
When corrupted schemas, silent ingestion drops, or unannounced upstream database alterations break production workflows, the failure ripples across your entire architecture, corrupting downstream analytics dashboards, poisoning machine learning feature stores, and eroding data trust.
While traditional data pipeline monitoring provides a necessary baseline for trapping explicit orchestration crashes, modern distributed ecosystems require an evolution toward data observability to diagnose the internal behavioral health of your records at scale.
Shifting from Reactive to Proactive Control:
- Trace End-to-End Lineage: Map data dependencies across your entire lifecycle to instantly isolate the root cause of a failure.
- Catch Silent Corruption: Use machine learning anomaly detection to flag distribution drops and partial ingestion failures that traditional uptime checks miss.
- Eliminate Data Downtime: Surface, diagnose, and remediate pipeline abnormalities in real time before they impact downstream business operations.
What Is Data Pipeline Monitoring?
Data pipeline monitoring is the practice of tracking and checking data as it moves through various pipeline stages, from initial ingestion, transformations, to storage and consumption. Its purpose is to catch issues like schema changes, missing data, or delays before they cause problems downstream. For comprehensive solutions, consider our Data Pipeline development services.
Monitoring is essential. It’s the first line of defense, helping teams catch obvious issues before they disrupt downstream processes. Common metrics tracked include:
- Freshness: Is the data up to date?
- Latency: How long does it take for data to move through the pipeline?
- Error rates: How many jobs are failing?
- Throughput: How much data is being processed?
Tools like cron jobs, basic logging, or simple dashboard alerts fall under this category. They’re straightforward and have been used for years. But they have limits.
What Is Data Observability?
While standard data pipeline monitoring only checks if a job passes or fails based on fixed rules, modern data observability looks deeper into your entire system health. Instead of watching for simple binary errors, it continuously tracks metadata, captures processing logs, monitors data distribution shifts, and maps data lineage.
By cross-referencing these runtime characteristics using machine learning anomaly detection, teams transition past isolated error alerts into true data pipeline observability.
What This Delivers:
- Automated Column Tracking: Trace records from source ingestion straight to the downstream business intelligence layer.
- Rapid Root-Cause Diagnosis: Pinpoint exactly where, when, and why a data anomaly occurred.
- Proactive Impact Assessments: Identify which downstream dashboards are broken before business stakeholders ever see them.
|
Observability Vector |
Technical Artifact Tracked |
Automated Validation Focus |
Engineering Value |
|
Performance |
Compute logs, query runtime slots |
Warehouse scaling & cost spikes |
Identifies resource-heavy transformation bottlenecks |
|
Quality |
Value distributions, null-rates |
Semantic out-of-bounds metrics |
Catches silent column-level data corruption at runtime |
|
Lineage |
Upstream & downstream schemas |
Column-to-dashboard dependency links |
Accelerates root-cause tracking and blast radius assessment |
This walkthrough provides a clear visual demonstration of using centralized data lineage maps, schema history trackers, and task duration history dashboards to resolve pipeline visibility blind spots across modern orchestration stacks: OpenMetadata Pipeline Observability Demo
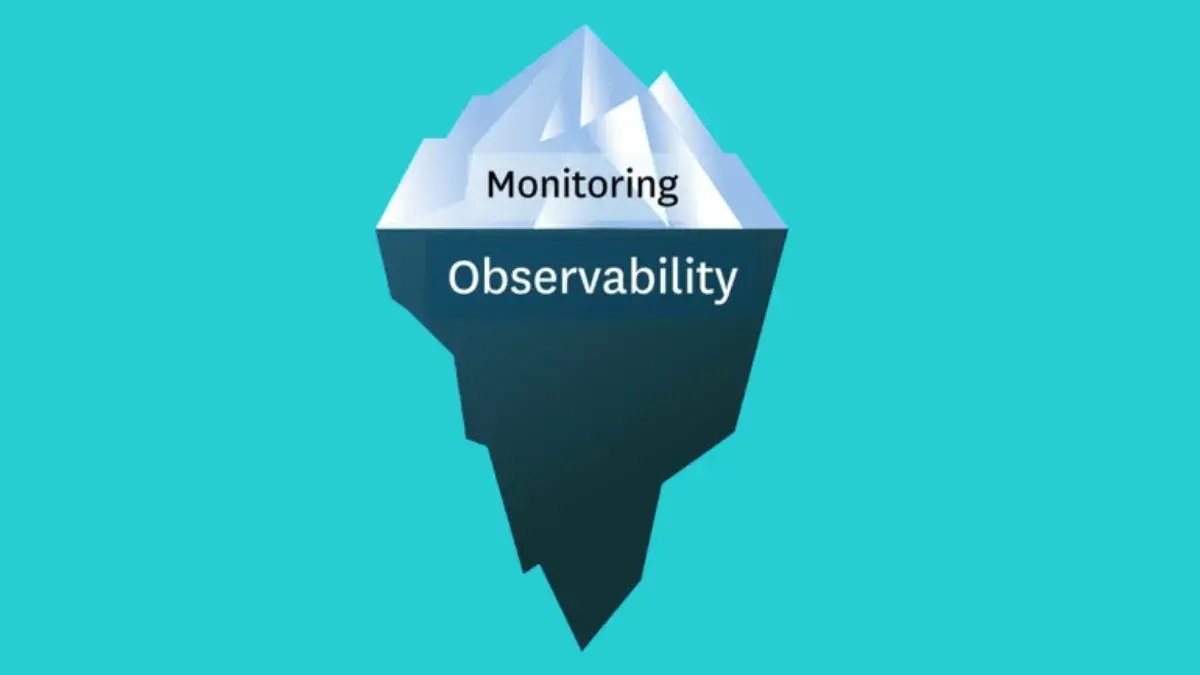
Core Differences: Monitoring vs. Data Observability
Understanding how to protect your data architecture requires drawing a clear line between tracking surface-level system events and diagnosing internal states.
Monitoring Data Quality Pipelines
Traditional monitoring relies on predefined, static rules to look for known failures at specific points within a data lifecycle. It operates on a binary threshold: a job either succeeds or it fails. If a cron job or an Airflow DAG times out, an alert is triggered. While this is necessary for tracking immediate operational health, it is fundamentally reactive and tells you nothing about the health of the records inside the file.
Data Engineering Observability Frameworks
Observability looks at the entire data ecosystem across multiple dimensions rather than checking isolated pipeline states. By cross-referencing system logs, runtime metrics, and metadata anomalies, observability builds a continuous model of how data behaves. Instead of simply alerting you that a database write failed, an observability framework provides the exact root-cause context: showing you that an upstream CRM update modified a field type, which broke a specific transformation layer and corrupted three downstream BI tables.
|
Evaluation Metric |
Pipeline Monitoring |
Data Observability |
|
Primary Objective |
Detects explicit pipeline failures |
Identifies root causes of data corruption |
|
Operational Stance |
Reactive (alerts after a failure event) |
Proactive (flags shifts in data behavior) |
|
System Scope |
Isolated, checkpoint-specific metrics |
End-to-end environment visibility |
|
Core Output |
States that an anomaly occurred |
Explains why it occurred and what is impacted |
|
Tooling Layer |
Basic logging scripts, system alerts |
Machine learning anomaly detection engines |
The Five Pillars of Modern Data Observability
True data trust is built on five core architectural vectors that trace data behavior from raw ingestion to consumption.
- Freshness: Tracks the arrival cadence and latency of data batches. It checks if your tables are updating according to your production SLAs, flagging when data streams stall.
- Volume: Measures the structural completeness of tables by analyzing row counts and byte sizes. A sudden drop from 2 million records down to 20,000 indicates a silent ingestion drop.
- Schema: Monitors the organization of your tables. It catches unannounced upstream migrations, such as deleted columns, re-typed fields, or renamed keys that break downstream code.
- Quality: Evaluates the actual values within the rows. Anomaly detection scripts flag unexpected changes in null-value percentages, out-of-bounds averages, or broken formatting patterns.
- Lineage: Maps the upstream dependencies and downstream consumers of every data asset. Automated data lineage tracking allows engineers to trace data flows through complex systems, making it easy to identify exactly where a failure started and which downstream dashboards are affected.
Evaluating the Technical Stack: Leading Tools
Choosing the right software depends on your pipeline complexity, data scale, and engineering overhead. The leading choices on the market approach data quality from different angles:
- Monte Carlo: An enterprise-grade, data observability platform that connects to data lakes and warehouses to provide out-of-the-box anomaly detection, end-to-end lineage tracking, and automated root-cause analysis with minimal configuration.
- Databand (IBM): Focuses heavily on engineering pipeline execution layers, tracking orchestration states within tools like Apache Airflow and dbt to catch data quality issues during the transformation process.
- Metaplane: A developer-friendly tool built for fast implementation, focusing on data quality anomalies and connecting directly into modern cloud data warehouses and downstream business intelligence tools.
- Soda Core: An open-source, developer-centric data validation framework that uses declarative YAML files to run structured quality checks across pipelines, making it ideal for integration into CI/CD workflows.
- AWS Deequ: An open-source tool built on top of Apache Spark, designed specifically for running unit tests on data at immense scale within distributed data lakes.
Operational Pipeline Health Audit Checklist
Use this copy-pasteable engineering checklist to audit your pipelines and determine if your data architecture requires an upgrade to automated observability tools:
- Static Error Handling: Do your systems alert you only when a data pipeline throws a hard error code, or can they detect when an ETL job runs successfully but writes empty rows?
- Upstream Schema Protection: Will an unannounced database change from a third-party API silently corrupt your analytics tables, or will your system flag the structural change automatically?
- Automated Context Tracking: When an executive flags an incorrect metric on a dashboard, can your team trace the data flow back to the exact source script in under five minutes?
- Baseline Profiling: Are your data validation parameters manually hardcoded, or do they automatically adapt to seasonal data fluctuations using historical trends?
- Downstream Impact Analysis: Can your data engineers see exactly which dashboards and machine learning models will be impacted before they change a production table schema?
Elevating Lakehouse Quality Assurance to Standard Practice
Data observability is now the industry standard for catching pipeline anomalies. It doesn't replace traditional monitoring; it builds on it by combining basic uptime logs with deep, real-time intelligence to give you full visibility into complex multi-cloud data environments.
The core of this shift relies on treating data as a product. By embedding automated verification directly into your data pipelines, engineering teams move away from manual, reactive firefighting and transition into a proactive, automated alerting architecture.
Driving the Paradigm Shift:
- Enforced Data Contracts: Establish clear, unbreakable structural boundaries between upstream data producers and downstream consumers.
- Strict Freshness SLAs: Automatically track data arrival cadences to ensure business dashboards never rely on stale datasets.
- Orchestration-Layer Checks: Catch schema drift and ingestion drops directly within your ETL/ELT pipelines before bad data propagates.
"We used to wait for a business stakeholder to email us about a corrupted dashboard or broken report. By shifting toward an automated data validation framework, we isolate schema anomalies and ingestion drops before downstream consumers ever realize a pipeline failure occurred." — Data Prism Engineering
Conclusion: Scaling Data Trust at Runtime
Relying strictly on surface-level data pipeline monitoring is no longer enough to maintain data trust across complex enterprise systems. While basic uptime alerts verify system availability, they cannot confirm if the data inside your tables is actually correct.
By moving up the data maturity curve and deploying automated observability frameworks, teams gain early warning signs, end-to-end visibility, and rapid root-cause analysis. This proactive approach shifts data quality management from a manual fire drill to a scalable engine, protecting business operations from costly downstream errors.
The Observability ROI:
- From Uptime to Data Truth: Move past asking "is the pipeline running?" to verifying "is the data correct?"
- Automated Engineering Engine: Replace manual schema tracking with automated, machine-learning-driven profiling checks.
- Protected Business Decisions: Isolate corrupted records at runtime before they reach executive dashboards or train predictive models.
Book a Free 30-Minute Meeting
Discover how our services can support your goals — no strings attached. Schedule your free 30-minute consultation today and let's explore the possibilities.
Book a Free Call